Modern organisations face an unprecedented challenge in maintaining team productivity and achieving strategic objectives. Research indicates that teams with clearly defined goals are 2.5 times more likely to achieve success compared to those operating without structured frameworks. The complexity of today’s business environment demands sophisticated approaches to goal setting and progress tracking that extend far beyond traditional methods. Effective team management requires a delicate balance between strategic vision and operational execution, where every milestone contributes to broader organisational success. Understanding how to establish meaningful objectives and monitor advancement systematically can transform team dynamics and deliver measurable business outcomes that drive sustainable growth.
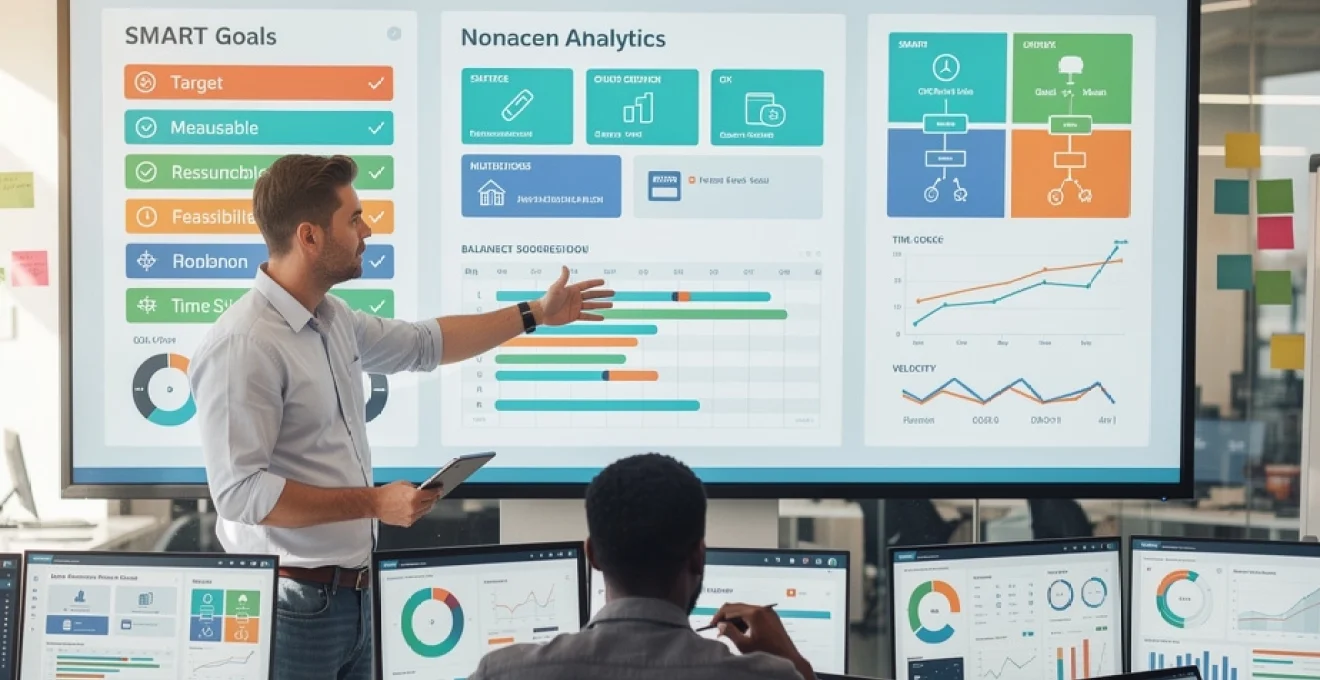
SMART goals framework implementation for team management
The SMART methodology remains one of the most effective frameworks for establishing clear, actionable objectives that teams can understand and execute consistently. This approach transforms vague aspirations into concrete targets that provide direction and motivation for team members across all organisational levels. Implementation requires careful consideration of each component to ensure goals remain both challenging and achievable within realistic timeframes.
Specific measurable criteria definition using KPI matrices
Establishing specific measurable criteria demands the creation of comprehensive KPI matrices that capture both quantitative and qualitative performance indicators. These matrices serve as the foundation for tracking progress and enable teams to understand precisely what success looks like in practical terms. Key performance indicators must align with business objectives whilst remaining relevant to individual team members’ daily activities.
Effective KPI matrices incorporate leading indicators that predict future performance alongside lagging indicators that measure outcomes. For instance, a marketing team might track lead generation rates (leading) while monitoring conversion rates (lagging) to gain comprehensive insights into campaign effectiveness. This dual approach provides early warning systems for potential challenges whilst maintaining focus on ultimate objectives.
The development of measurement criteria requires input from multiple stakeholders to ensure relevance and buy-in across the organisation. Regular review cycles should be established to refine measurements based on changing business conditions and emerging priorities. Teams benefit from having no more than five primary KPIs to maintain focus and avoid overwhelming members with excessive metrics.
Achievable target setting through resource assessment models
Resource assessment models provide the analytical framework necessary to establish realistic, achievable targets that challenge teams without creating unattainable expectations. These models evaluate available human resources, technological capabilities, budget constraints, and time limitations to determine optimal goal parameters. Successful implementation requires honest evaluation of current capacity alongside consideration of potential resource acquisition or reallocation.
Historical performance data serves as a valuable baseline for target setting, providing context for what teams have accomplished previously under similar conditions. However, this historical perspective must be balanced with growth aspirations and changing market dynamics. Teams should consider factors such as skill development, process improvements, and technological enhancements that might enable higher performance levels.
Risk assessment forms a crucial component of achievable target setting, identifying potential obstacles and developing contingency plans. This proactive approach helps teams maintain momentum when unexpected challenges arise and prevents goal abandonment due to unforeseen circumstances. Regular resource reviews ensure targets remain realistic as conditions change throughout the goal period.
Relevant objective alignment with organisational strategic pillars
Alignment between team objectives and organisational strategic pillars ensures that individual efforts contribute meaningfully to broader business success. This connection provides team members with a clear understanding of how their work impacts company performance and creates a sense of purpose beyond immediate tasks. Strategic alignment also facilitates resource allocation decisions and helps prioritise competing demands on team attention.
The alignment process begins with comprehensive understanding of organisational strategy, including mission, vision, values, and strategic priorities. Team leaders must translate these high-level concepts into specific objectives that resonate with team members’ roles and responsibilities. Regular communication about strategic context helps maintain alignment as both strategies and team capabilities evolve.
Cross-functional collaboration becomes essential when ensuring objective relevance, as team goals often impact other departments and organisational functions. Regular strategic reviews help identify potential conflicts or opportunities for synergy between different team objectives. This collaborative approach strengthens overall organisational coherence and maximises the collective impact of individual team contributions.
Time-bound milestone creation using gantt chart methodologies
Gantt chart methodologies provide visual frameworks for establishing time-bound milestones that break complex objectives into manageable phases. These tools enable teams to understand dependencies between tasks, identify critical path activities, and allocate time resources effectively. The visual nature of Gantt charts facilitates
rapid comprehension of timelines and facilitates proactive adjustment when delays or bottlenecks emerge. By plotting start and end dates, dependencies, and buffer periods, teams can visualise how individual tasks contribute to overarching project goals and where schedule risks may appear. This level of visibility is particularly valuable when managing distributed teams or complex, multi-phase initiatives that require tight coordination across functions.
To use time-bound milestones effectively, teams should define intermediate checkpoints that sit between the current state and the final objective. Each milestone should include clear acceptance criteria, responsible owners, and indicative effort estimates. When combined with regular progress reviews, Gantt charts become living documents rather than static plans, enabling teams to re-sequence work, reassign resources, or adjust scope without losing sight of strategic objectives.
Modern project management tools have further enhanced traditional Gantt chart methodologies by enabling real-time updates, automatic dependency adjustments, and integration with resource calendars. This reduces the administrative burden on project managers and helps team members understand how their progress affects the overall timeline. Ultimately, time-bound milestone creation ensures that SMART goals do not remain theoretical but are translated into a practical execution roadmap that can be monitored and refined.
Advanced project management software integration for goal tracking
As organisations scale, spreadsheets and manual check-ins quickly become inadequate for reliable goal tracking and team progress monitoring. Advanced project management software provides centralised platforms where objectives, tasks, timelines, and performance metrics converge. When configured correctly, these tools transform abstract team goals into structured workflows with clear ownership, automated reminders, and real-time status visibility. The key is selecting solutions that align with your operating model and customising them to reflect your SMART goals, KPIs, and reporting requirements.
Asana workflow automation and custom field configuration
Asana offers robust capabilities for translating team goals into structured projects and workflows. By leveraging sections, task templates, and dependencies, you can map each objective to a series of actionable steps with clear assignees and due dates. Workflow automation rules further enhance efficiency by triggering actions such as status updates, stakeholder notifications, or task creation when specific conditions are met, reducing manual follow-up and ensuring consistent execution across projects.
Custom fields in Asana are particularly powerful for goal tracking, as they allow you to embed measurable criteria directly into tasks. For example, you might add fields for estimated hours, priority level, revenue impact, or associated KPI. These data points can then be surfaced in dashboards and portfolio views, enabling managers to analyse progress against targets without exporting data into external systems. When combined with custom field-based filters, teams can quickly identify at-risk items, high-impact initiatives, or bottlenecks.
To maximise the value of Asana for team performance tracking, it is important to establish standard conventions for project structures, naming, and field usage. Consistency ensures that reports and dashboards present comparable data across teams and time periods. Regular training sessions and short process guides help team members adopt these conventions, turning Asana from a simple task list into a strategic execution platform that underpins data-driven decision making.
Monday.com dashboard customisation and progress visualisation
Monday.com excels at providing highly visual, configurable workspaces that make team progress tracking intuitive and engaging. Boards can be tailored to reflect different goal hierarchies, from high-level strategic initiatives down to sprint-level tasks. Columns such as status, owner, timeline, effort, and numerical metrics allow you to capture the full context of each item and monitor its contribution to broader objectives. Colour-coded statuses and timeline bars make it easy to see at a glance where work is on track or slipping.
Custom dashboards consolidate data from multiple boards, offering managers a holistic view of work across teams, products, or regions. Widgets such as charts, numbers, workload views, and goal progress indicators help visualise KPIs and milestones in real time. For instance, a sales operations leader might create a dashboard showing pipeline value by stage, average deal cycle time, and progress towards quarterly revenue targets, all updated automatically as team members update their boards.
Automation recipes further streamline goal tracking in Monday.com by connecting events and actions across boards and tools. You can automatically notify stakeholders when key milestones are reached, update statuses when due dates change, or synchronise items with CRM and support systems. By designing dashboards and automations around your SMART goals and KPI structure, Monday.com becomes a dynamic control centre that supports both day-to-day execution and strategic oversight.
Jira agile sprint planning and velocity tracking implementation
For software development and other agile teams, Jira provides a specialised environment for planning sprints, prioritising backlogs, and tracking delivery performance. Sprint planning begins with a well-groomed backlog, where each issue is clearly described, estimated, and aligned to an epic or higher-level objective. During planning sessions, teams commit to a realistic set of issues based on historical velocity, resource availability, and upcoming constraints, ensuring that sprint goals are both ambitious and achievable.
Velocity tracking is central to Jira’s value for agile goal setting. By measuring the amount of work completed in each sprint, typically in story points, teams gain an empirical basis for forecasting future delivery capacity. Over time, patterns emerge that help leaders understand how factors such as team composition, technical debt, and scope changes influence throughput. This data enhances predictability and supports more accurate commitments to stakeholders regarding release dates and feature sets.
Jira’s reports—such as burndown charts, control charts, and cumulative flow diagrams—offer rich insights into team performance and process efficiency. When interpreted regularly in sprint reviews and retrospectives, these analytics highlight where work is blocked, where lead times are increasing, or where scope creep is occurring. By linking Jira epics and releases to strategic objectives, organisations can trace how incremental sprint outcomes contribute to long-term product roadmaps and business results.
Microsoft project timeline management and resource allocation
Microsoft Project remains a cornerstone solution for organisations managing large, complex initiatives with strict dependencies and resource constraints. Its powerful scheduling engine allows project managers to build detailed work breakdown structures, define task relationships, and model different scenarios before committing to a baseline plan. This level of granularity is especially valuable for capital projects, infrastructure upgrades, and cross-functional programmes with multiple workstreams.
Resource allocation capabilities in Microsoft Project enable you to assign people, equipment, and budget to specific tasks while monitoring utilisation levels. Over-allocation warnings signal when team members are stretched too thin, prompting redistributions that prevent burnout and maintain quality. Cost tracking features allow you to compare planned versus actual expenditure, ensuring that financial constraints are respected alongside schedule and scope considerations.
Integrations with the broader Microsoft 365 ecosystem, including Teams, SharePoint, and Power BI, extend Microsoft Project’s role in goal tracking. Status updates, risk logs, and change requests can be surfaced in collaborative channels, while executive dashboards display high-level progress indicators and variance analyses. When used as part of a wider portfolio management approach, Microsoft Project helps leaders prioritise initiatives, sequence investments, and align project outcomes with strategic pillars.
Trello power-up integration for enhanced productivity metrics
Trello’s card-and-board metaphor offers a lightweight yet flexible framework for managing team goals, particularly for small teams or non-technical departments. By arranging work into lists such as “Backlog,” “In Progress,” and “Done,” teams create a simple visual workflow that supports daily stand-ups and status reviews. Each card can store checklists, attachments, due dates, and comments, providing a single source of truth for task-level information.
Power-Ups extend Trello’s capabilities and are essential for robust productivity tracking. Time-tracking Power-Ups, for instance, allow teams to log effort directly on cards, enabling analysis of how long different work types actually take. Calendar and Gantt-style Power-Ups translate board data into schedule views, helping teams manage deadlines and avoid overloading specific weeks. Reporting and dashboard Power-Ups aggregate card data across boards, making it possible to monitor throughput, cycle time, and task distribution by team member or category.
To turn Trello into an effective goal tracking system, it is useful to establish a small set of standard boards and workflows, along with guidelines on how to use labels, due dates, and checklists. Linking cards to higher-level objectives or OKRs, whether via card titles, labels, or custom fields, ensures that day-to-day tasks remain connected to strategic priorities. With thoughtful configuration, Trello can evolve from a simple task list into a lightweight project management system that surfaces meaningful performance metrics.
Team performance metrics and analytics dashboard development
Defining clear goals is only half of the equation; you also need robust mechanisms for measuring whether teams are moving in the right direction. Well-designed performance metrics and analytics dashboards provide this visibility, enabling leaders to identify trends, anticipate issues, and celebrate wins. The challenge lies in selecting a balanced set of indicators that reflect both short-term execution and long-term strategic impact without overwhelming stakeholders with data.
Balanced scorecard implementation for multi-dimensional assessment
The balanced scorecard framework remains a powerful tool for assessing team performance across multiple dimensions rather than relying solely on financial outcomes. By examining perspectives such as financial results, customer impact, internal processes, and learning and growth, organisations gain a more holistic understanding of how teams contribute to success. This multi-dimensional assessment is particularly useful in knowledge-based environments where intangible assets like expertise and innovation drive competitive advantage.
Implementing a balanced scorecard at the team level involves translating high-level organisational objectives into specific, measurable indicators for each perspective. For example, a customer support team might track first-contact resolution rate (customer), average handle time (process), cross-training completion (learning and growth), and cost per ticket (financial). These metrics collectively reveal whether improvements in efficiency are also enhancing customer satisfaction and building long-term capability.
To ensure the balanced scorecard remains actionable, it should be embedded into regular review cycles and performance conversations. Dashboards that visualise scorecard metrics with clear targets and traffic-light indicators make it easier for teams to understand where they are performing well and where adjustments are required. Over time, the balanced scorecard becomes more than a reporting tool; it functions as a strategic learning system that guides continuous improvement and resource allocation.
OKR cascade methodology from strategic to operational levels
Objectives and Key Results (OKRs) provide a structured way to connect ambitious goals with measurable outcomes across the organisation. Cascading OKRs from the corporate level down to departments and teams ensures that everyone is pulling in the same direction. At the top, leadership defines a small set of strategic objectives for the quarter or year. These then inform departmental objectives, which in turn guide team-level and, where appropriate, individual OKRs.
Effective OKR cascading is less about rigid top-down translation and more about alignment through dialogue. Teams should be empowered to propose how they can best contribute to higher-level objectives, defining their own key results that are both measurable and within their control. For instance, if the company objective is to “Increase customer lifetime value,” a product team might set an OKR around improving feature adoption, while the customer success team focuses on reducing churn in a specific segment.
Tracking progress on OKRs requires transparent systems where key results are updated regularly, ideally weekly or bi-weekly. Visual OKR dashboards help everyone see which objectives are on track, which are at risk, and where additional support is needed. By reviewing OKRs in cadence meetings and retrospectives, organisations build a culture where goals are not static documents but living commitments that evolve based on learning and changing conditions.
Real-time performance indicator monitoring using business intelligence tools
Business intelligence (BI) tools such as Power BI, Tableau, and Looker enable organisations to move beyond static reports towards real-time performance monitoring. By connecting directly to operational systems—project management tools, CRMs, HR platforms, and financial software—these tools aggregate data into interactive dashboards that update as work progresses. This allows leaders to detect deviations from expected performance much sooner than with traditional monthly or quarterly reporting cycles.
Designing effective BI dashboards for team progress tracking starts with clarity about the questions you want to answer. Do you need to know which projects are at highest risk? Which teams are approaching capacity limits? Which key results are lagging behind expectations? Once these questions are defined, you can select appropriate metrics, visualisations, and filters that make it easy for users to explore the data. Simple, focused dashboards tend to drive better decisions than complex ones overloaded with charts.
Real-time monitoring is only valuable if it leads to timely action. Establishing thresholds and alert rules—such as notifications when KPI values cross a certain boundary—helps teams respond quickly to emerging issues. When combined with recurring review meetings, BI dashboards create a feedback loop where data informs decisions, decisions alter actions, and new data reveals the impact. Over time, this analytics-driven approach strengthens organisational agility and resilience.
Burndown chart analysis and sprint retrospective frameworks
Burndown charts are a staple of agile methodologies and offer a straightforward visual representation of work remaining versus time. By plotting the total estimated effort at the start of a sprint and tracking how much remains each day, teams can quickly see whether they are likely to complete their commitments. A burndown line that remains flat or declines too slowly signals that tasks are blocked, underestimated, or accumulating scope, prompting timely intervention.
Analysing burndown charts over multiple sprints reveals patterns in estimation accuracy, scope management, and team stability. For example, repeated “hockey stick” patterns—where most work is completed at the end of the sprint—may indicate that testing is left too late or that work-in-progress limits are not being respected. These insights become valuable discussion points in sprint retrospectives, where the objective is to understand root causes rather than assign blame.
Structured retrospective frameworks, such as “Start, Stop, Continue” or “Mad, Sad, Glad,” encourage teams to reflect on both quantitative data and qualitative experiences. By combining burndown analysis with open dialogue about collaboration, tooling, and stakeholder interactions, teams can identify practical experiments to improve their next sprint. Documenting these actions and reviewing their impact fosters a culture of continuous improvement grounded in evidence.
Communication protocols and progress reporting systems
Even the most sophisticated goal-setting frameworks and analytics dashboards will fail without effective communication protocols. Teams need clear expectations about how often progress will be reported, in what format, and to whom. Well-designed communication rhythms ensure that everyone remains informed without being overwhelmed by meetings or fragmented updates. They also build trust by creating transparency around performance, risks, and decision-making.
Establishing a tiered communication structure can help balance detail with efficiency. At the operational level, brief daily or twice-weekly stand-ups keep team members aligned on immediate priorities and blockers. At the tactical level, weekly or bi-weekly check-ins focus on progress against sprint goals, project milestones, or OKRs. At the strategic level, monthly or quarterly reviews bring together leaders to assess performance against broader organisational objectives and adjust priorities as needed.
Standardised reporting formats further enhance clarity. For instance, teams might adopt a simple structure such as “Planned, Progress, Problems, and Plans” for written updates. Visual summaries—traffic light status indicators, simple charts, and concise commentary—make it easier for busy stakeholders to grasp the situation quickly. Wherever possible, progress reports should be generated directly from project management and analytics tools to reduce manual effort and ensure data consistency.
Technology plays a critical role in sustaining communication protocols for tracking team progress. Collaboration platforms such as Microsoft Teams, Slack, or similar tools can host dedicated channels for projects, OKRs, or departments, providing a persistent record of decisions and updates. Integrations with project management and BI systems allow automatic posting of status changes or KPI thresholds, reducing the need for ad hoc enquiries. By designing communication flows deliberately rather than allowing them to emerge organically, organisations create an environment where information supports action rather than adding noise.
Data-driven decision making through performance analytics
In an environment where teams are expected to move quickly and adapt to change, intuition alone is no longer sufficient for reliable decision making. Performance analytics provide the evidence base needed to evaluate options, prioritise initiatives, and allocate resources where they will have the greatest impact. When leaders and teams develop the habit of consulting data before making significant decisions, they reduce bias, increase accountability, and improve outcomes over time.
Implementing data-driven decision making starts with defining clear questions and hypotheses. For example, you might ask, “Does investing in additional onboarding support reduce time-to-productivity for new hires?” or “Which type of marketing campaign generates the highest long-term customer value?” Once these questions are framed, teams can identify relevant metrics, design experiments, and collect the necessary data. The goal is not to amass as many metrics as possible but to focus on those that directly inform critical decisions.
Analytical techniques can range from simple trend analysis and cohort comparisons to more advanced approaches such as regression modelling or predictive analytics. Many modern tools embed these capabilities into user-friendly interfaces, allowing non-specialists to explore patterns without deep statistical expertise. However, it remains important to cultivate basic data literacy across the organisation so that team members can interpret charts correctly, recognise limitations, and avoid common pitfalls such as confusing correlation with causation.
To embed analytics in everyday decision making, organisations should integrate key insights into regular planning and review cycles. For instance, quarterly strategy sessions might begin with a review of progress against critical KPIs and OKRs, followed by discussion of root causes and potential responses. Scenario analysis—modelling how different choices might affect outcomes—can then guide resource allocation and goal adjustments. Over time, this disciplined approach transforms performance analytics from a retrospective reporting function into a proactive steering mechanism for the business.
Continuous improvement methodologies and goal refinement processes
Clear goals and robust tracking systems are not static constructs; they must evolve as teams learn and conditions change. Continuous improvement methodologies such as PDCA (Plan-Do-Check-Act), Kaizen, and agile practices provide structured approaches for iteratively enhancing both performance and the goals themselves. Rather than treating objectives as fixed for a full year, high-performing organisations view them as hypotheses to be tested and refined based on evidence.
Goal refinement begins with honest reflection on what current metrics reveal. Are targets consistently missed despite strong effort, suggesting that assumptions were unrealistic or external conditions shifted? Are some goals routinely exceeded with minimal strain, indicating that they may no longer be stretching the team? By examining both successes and shortfalls, teams can recalibrate objectives to maintain an optimal balance between challenge and achievability.
Retrospectives and post-mortems are powerful forums for this reflection. After completing a project or reaching a key milestone, teams can review what worked, what did not, and what surprised them. Importantly, this review should extend beyond processes and behaviours to include the design of the goals themselves. Questions such as “Did our KPIs truly reflect success?” or “Were our milestones sequenced logically?” help uncover opportunities to improve future goal-setting cycles.
Embedding continuous improvement into daily work requires more than occasional workshops; it calls for a cultural shift where experimentation and learning are valued. Small, low-risk experiments—such as adjusting a single KPI, piloting a new reporting cadence, or trialling a different estimation technique—allow teams to gather evidence without jeopardising major outcomes. As positive results accumulate, these experiments can be scaled and standardised, steadily raising the organisation’s capability to set clear goals and track team progress efficiently.